

Assessing the quality of service provided by the peering platform has been a long-debated argument in the IXP community for years. Besides impacting commercial aspects, such as business continuity and commitment to SLAs, the ability to monitor the performance of the peering platform is a valuable tool to assess overall platform health and to foresee and prevent service degradation. While measuring the performance of a single-location peering point might look superfluous, it may not be trivial in the case an IXP is distributed across multiple geographical sites as latency and other performance-related indicators may be affected by data center interconnect (DCI) infrastructures performance as well.
A traditional approach
Before we start talking about “performance”, we need to define some indicators for it and then devise a way to measure them in a reliable and repeatable way. A traditional approach is to use ICMP packets (ping) to determine the round trip time (RTT) between any two points at the edge of the platform. Widely available ping tools generally provide a set of statistics about RTT which include min/max/average values and standard deviation measured over a repeated series of probes. This may not be the most accurate tool since ICMP packets are not so representative of generic traffic passing through a peering platform, but we can assume it is a “baseline” measurement that can give us an initial, neutral assessment of overall performance.
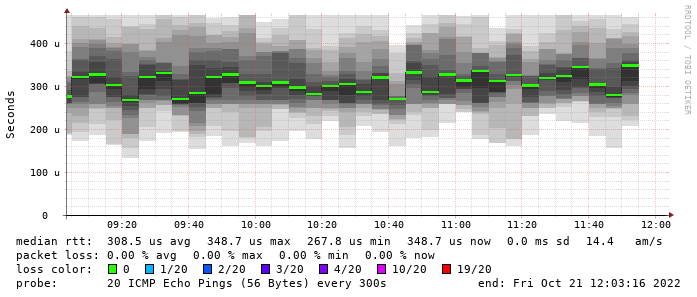
Most IXPs have been using a classical tool, Smokeping, to perform routine checks of peer reachability across the peering platform. Smokeping inserts data collected from periodic measurements into round-robin databases, these data can then be published into a visually pleasing form that provides instant feedback about a peer’s health. Average response times are represented in color, surrounded by a smoky cloud (that’s where the tool’s name comes from!) that gives a hint about the dispersion of values from its average.
Despite being an easy off-the-shelf solution, the usual Smokeping deployment has some drawbacks:
- it shows the “point of view” of a single probe that pings all the other routers in the platform;
- as it shows a logical view of the network, it hides information about where exactly each target is located;
- it relies on responses from hardware routers, which may choose not to prioritize ICMP traffic and thus provide inaccurate or heterogeneous results.
that’s why we wanted to go a step further and adopt a more flexible approach that included the use of dedicated probes along with information about their location in space.
Introducing the IXPQoS framework
We devised the IXPQoS framework as a client-server system that includes:
- a set of hardware probes equipped with dedicated software and distributed at each geographical site hosting an edge node of the peering platform
- a central server that takes care of:
- distributing the operating configuration to each probe
- collecting and storing results from probes
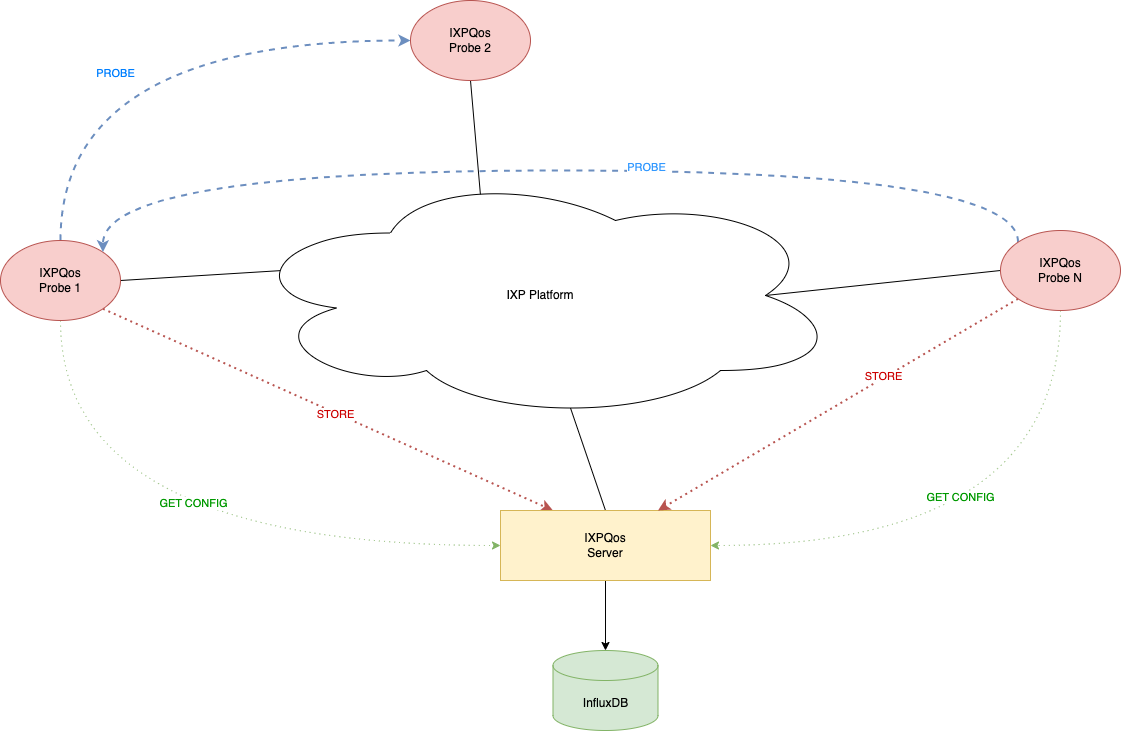
Server description
The central server exposes its services to client probes by means of a RESTful API, at the current moment two services have been defined:
- Configuration repository: upon request, the server provides a client probe with a configuration set that includes information about:
- how many target probes are registered with the system, along with their IP addresses;
- how to execute a probing session, which means the number and the rate of pings to perform against each target;
- Result collection: after a client probe has performed its probing session, it posts the results to the server.
In its turn, the server stores the result in a time-series database (we chose InfluxDB as a backend) according to a format that includes information about the source and target probes associated with each measurement.
Client description
Client software consists in a script that may be periodically run by a cronjob (every 5 minutes), and performs the following activities:
- Request the server for current configuration: list of active target probes and probe session specifications
- For each probe in the list:
- Perform a probe session and collect results
- Post results to the server for persistent storage
A probe session is performed by sending out a given number of ICMP packets toward each target. Response times are then collected and min/max/average and standard deviation values are computed out of the results, along with packet loss information (if any).
System deployment
Client probes have been made from cheap Intel-based mini-PCs running Ubuntu Linux and equipped with IXPQos client software, a probe has been installed at each site (currently, 3 sites across the metropolitan area) and connected to the peering platform by means of a 1 GigabitEthernet connection.
In order to separate IXPQos probe traffic from peering traffic and avoid wasting public IP addresses, a dedicated VLAN has been defined over the peering platform, to which both server and clients are connected. The server instance is installed at the main Namex site.
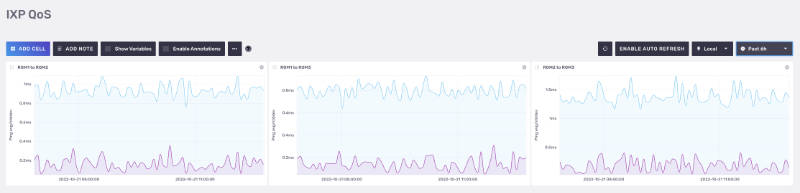
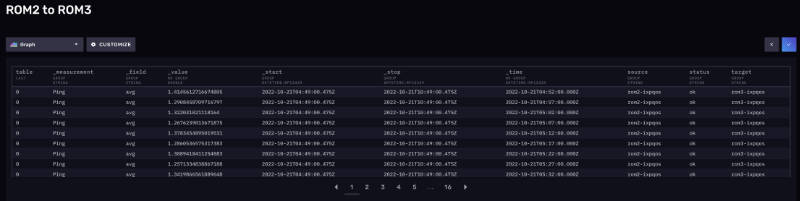
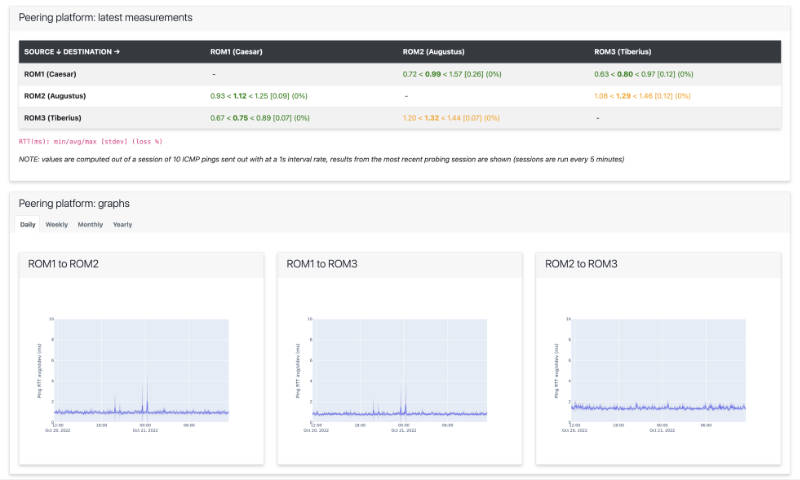
Examples
Conclusions and future developments
Deployment of the IXPQoS system has enabled us to grasp a quick, standardized, and non-biased view of overall connectivity status across the peering platform. While traditional Smokeping deployment (which we run embedded into IXP Manager statistics) can still give us useful information about each individual peer, a more generic and standardized approach is preferable to assess overall platform performance in a multi-site environment. Since the platform has a star architecture, with the main historical side at the center, the distribution of probes across the geographical nodes provides instant feedback about edge-to-edge performance between any two peripheral sites. Moreover, the retainment of historical data gives us advice on possible service degradation or any unexpected modification in DCI performance.
So far we have devised the basic architecture and implemented the minimum number of services needed to run an operational measurement testbed.
We are thinking about expanding on this architecture by adding several features, including:
- Support for the management of planned maintenance activities, with temporary flagging of client probes as non-operational;
- Definition of a custom API for extracting data from the persistent database (data is currently read by direct interaction between external tools and InfluxDB);
- A monitoring, per-site threshold-based system to produce alerts and warnings.
IXPQos software is fully written in Python 3 and currently relies on the ping3 external package. We plan to release the code as open source as soon as it is fully consolidated.